The Solution to Severe Malnutrition Denials: Document the Treatment!

The CMS Office of Inspector General (OIG) released a report in July 2020 claiming that hospitals over-billed Medicare approximately $1 billion in a two-year period for claims that included a secondary diagnosis of severe malnutrition.  

The OIG audited 200 claims randomly selected from a total of 224,175 claims from fiscal years 2016 and 2017 that contained code E43 (unspecified severe protein-calorie malnutrition) or E41 (nutritional marasmus) which are classified as MCCs.  

Severe Malnutrition OIG Audit Findings

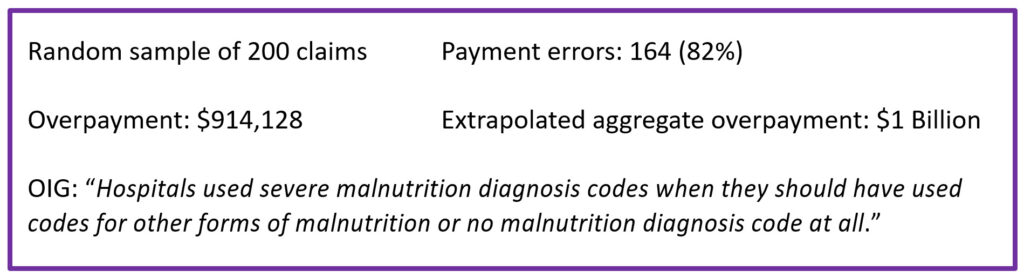
OIG audit findings. The auditors found that, in 164 of the 200 claims reviewed, the diagnosis of severe malnutrition was not clinically supported. The denials were based on ASPEN diagnostic criteria and lack of evidence that the treatment was congruent with the severity of illness in intensity and complexity.  In other words, many of the 164 claims failed to show the complex decision-making and intense intervention expected for severe malnutrition.

Clinical validation of severe malnutrition. For many years, our CDI Pocket Guide® has cautioned hospitals and providers that the clinical validity of any diagnosis depends, in part, on providing the management expected for the condition. For example, a diagnosis of gram-negative or staph pneumonia will not be considered clinically valid if azithromycin is the only antibiotic administered; a diagnosis of acute kidney injury (AKI) will not be considered clinically valid without hydration and monitoring of creatinine levels for improvement.

In the case of severe malnutrition, things become a bit more complicated since many patients may meet two ASPEN criteria for severe malnutrition but not receive the intense management or treatment expected with this diagnosis. Much like marasmus and kwashiorkor in underdeveloped countries, severe protein-calorie malnutrition (code E43) in the United States should be considered a serious, potentially life-threatening situation requiring carefully monitored, aggressive management.

What treatment is congruent with severe malnutrition?  While a patient who has non-severe malnutrition may be seen by a nutritionist, who would likely recommend a nutritious diet along with one to two daily liquid supplements (e.g., Boost), a patient with severe malnutrition would be expected to receive some of the following:

Let's look at two cases to illustrate the difference.

Case study #1: A 91-year-old female with a history of dementia was admitted with rectal pain and severe fecal impaction. Colonoscopy revealed stercoral colitis and multiple mucosal ulcers.  The gastroenterologist diagnosed “severe protein-calorie malnutrition.” The nutritionist documented “inadequate calorie intake; 8% weight loss in last 1.5 months” and “high risk.” The patient’s BMI was 24 (upper end of normal). The patient was treated with IV Cipro and Flagyl, advancement of diet as tolerated, with Boost twice a day.

Case study #2: An 80-year-old female with congestive heart failure who lives alone at home was admitted after two weeks of increasingly severe diarrhea and abdominal pain. She had been recently treated with antibiotics for recurrent urinary tract infection. Physical exam revealed a frail, thin female who needs assistance getting up from a chair and generalized weakness. Lab results included CRP 5.5 (range 0.3-1.0), albumin 2.8 (range 3.4-5.4); prealbumin 11.0 (range 15-36), and positive C. diff toxin. She was diagnosed with C. diff colitis and transferred to rehab after a five-day hospital stay. The nutritionist documented a 6% weight loss over the past month and a BMI of 19.3. Appetite was poor and the patient consumed < 75% calories for 3 weeks. No obvious muscle mass or subcutaneous fat loss. She was treated with Boost 3-4 times daily and daily calorie counts to monitor calorie intake.  

Which of these patients would be considered to demonstrate "severe” malnutrition? 

Patient #1 meets the ASPEN criteria for severe malnutrition due to reduced calorie intake and weight loss in an acute setting, but her treatment (Boost twice a day) would likely be interpreted as mild or moderate malnutrition, despite the fact that her dementia likely means she will need ongoing nutritional monitoring. Also, her BMI indicates she is not severely malnourished.  Patient #2 meets GLIM (but not ASPEN) criteria for severe malnutrition, because of her BMI of 19.3 (< 22 if ≥ 70 years old), documented reduced nutritional intake for over two weeks, and evidence of acute disease with severe systemic inflammation (C. diff colitis with elevated CRP). The patient’s documented treatment (3-4 daily liquid supplements plus daily calorie counts) is more consistent with a diagnosis of severe malnutrition.  

How to prevent malnutrition denials.  As usual, the answer is in the documentation—of both the diagnostic criteria met and the treatment that matches the severity of the diagnosis.

          Select either the ASPEN or GLIM criteria, not both. Hospitals should establish a diagnostic standard and organization guidelines for malnutrition and involve the compliance department. Choose either ASPEN or the more recent international GLIM criteria and use the criteria consistently across the institution. Be sure your nutritionist documentation includes the specific ASPEN or GLIM criteria that are met. Educate clinicians.

          Ensure the treatment plan is as intense as the diagnosis is severe. If the treatment plan does not contain some of the treatment indicators above for "severe malnutrition," the diagnosis of severe malnutrition is likely to be considered invalid. 

Appealing severe malnutrition denials. As a result of this audit, CMS has instructed its audit contractors to recover the 164 identified overpayments and to review additional claims from the 224,000+ audit sample to recover additional overpayments for severe malnutrition. So, get ready to defend your claims.  

Do not appeal all denials. If after a review of the medical record, the documentation clearly does not meet the clinical criteria or treatment expected for severe malnutrition, do not appeal—it will waste everyone’s time.  

If the diagnosis of severe malnutrition is clinically supported, however, include these three elements in your appeal letter:

  1. High-risk patient:  Any past medical history, social/environmental issues, or current conditions that support a high risk for malnutrition.
  2. Diagnostic criteria:  The specific diagnostic criteria that are supported by the medical record findings – either ASPEN or GLIM.
  3. Treatment:  The intensity of treatment that fits the diagnosis. 

In the above case studies, case #1 would likely not succeed in an appeal.

Although the OIG audit suggests that severe malnutrition is over-reported, the major nutrition societies report widespread under-recognition and under-treatment of malnutrition.  Clearly, there is a need for authoritative diagnostic standards and clinician education, but the best way we can help determine the prevalence of malnutrition is to ensure accurate medical record documentation.

Get our CDI Pocket Guide® for more information on malnutrition.

Big Change for Glasgow Coma Scale Codes for FY2021

In probably the most important change to the FY2021 ICD-10-CM guidelines, the reporting of Glasgow Coma Scale codes has been revised to refer only to trauma cases.

Get our CDI Pocket Guide® to learn more about the GCS and documentation of coma.

During her annual ICD-10 update webinar, Nelly Leon-Chisen, Director of Coding and Classification at the American Hospital Association and its representative to the ICD-10 Coordination and Maintenance Committee, confirmed the intent of the guideline to prohibit Glasgow Coma Scale reporting in non-trauma. In response to an inquiry, Ms. Leon-Chisen replied:

“For the coma scale guideline, the codes can now only be used for traumatic brain injury. The rationale is that as the codes were expanded to more and more conditions, there were more questions coming in which required review by the Editorial Advisory Board. It became clear that people were looking to use them for situations the codes were never intended for and therefore couldn’t be applied. After considerable discussion, the EAB recommended that the application of those codes be rolled back to their original intent, which was for traumatic brain injuries.”

Ms. Leon-Chisen also stated that Coding Clinic does not plan to publish a further clarification. Given the confusion and questions about the change we hope they will reconsider and offer additional specific guidance.

Glasgow Coma Scale is the only objective standard for quantitating the degree of altered level of consciousness, diagnosing coma, and are used almost uniformly in the medical community in all conditions (traumatic and non-traumatic). Glasgow Coma Scale scores that generally correspond to clinical levels of altered consciousness are shown below:

Coma may also be diagnosed by the clinician’s overall subjective impression of a patient’s level of consciousness and responsiveness.

While the Glasgow Coma Scale can no longer be reported in non-trauma cases, coma can be and is an MCC. We recommend coding and CDI specialists consider a query for coma when the record reports a Glasgow Coma Scale score of </= to 8.

Heart Failure Update: Clarifying New Terminology

By now all of us should be familiar with the terminology and coding for heart failure with reduced ejection fraction (HFrEF), which is properly indexed to systolic heart failure, whereas heart failure with preserved ejection fraction (HFpEF) is properly indexed to diastolic heart failure.  The most up to date clinical definition of systolic heart failure is an ejection fraction < 50% and, in diastolic heart failure, the ejection fraction >= 50%.

A new term has been recently introduced: heart failure with “mid-range” ejection fraction (HFmrEF) defined as EF is 41– 49%. Those who employ the term HFmrEF consider systolic failure to be EF <41%. The clinical significance of the mid-range EF compared with EF reduced below 41% are yet unknown. Coding Clinic 2020 Third Quarter, p. 32, advises to code chronic systolic heart failure for patients with heart failure described with reduced, mildly reduced, or mid-range ejection fraction. This makes perfect sense because systolic failure is recognized as EF < 50%.

Yet another new term has recently been proposed: heart failure with recovered ejection fraction (HFrecEF) which is intended to describe a significant improvement in a reduced EF (systolic heart failure) usually following aortic valve replacement such as TAVR. Coding Clinic 2020 Third Quarter, p. 32, also advises to code chronic diastolic heart failure for patients with a “recovered” EF that is above 50%. It does not address what to do about “recovery” to an EF < 50%, which is clinically systolic failure. If the EF does not recover to normal, a query may be necessary to determine if the recovered EF represents systolic or diastolic failure.

Get our CDI Pocket Guide® for more help with heart failure.   

In summary:

Pancytopenia: Neutrophils vs. White Blood Cells

Pancytopenia is a simultaneous deficiency of three blood cell lineages: red blood cells, platelets, and neutrophils. Its clinical significance is the triple impact of anemia (decreased tissue oxygen supply), thrombocytopenia (bleeding), and neutropenia (susceptibility to infection).

Confusion arises because the literature sometimes defines pancytopenia as low counts of red blood cells, platelets, and white blood cells.

Which is correct?

It helps to understand that the population of white blood cells actually contains at least four subtypes, depending on how you count: neutrophils (including eosinophils and basophils), monocytes, B- and T-lymphocytes.

The monocytes, B and T cells are usually not reduced in number by conditions that cause pancytopenia, but neutrophils are. Out of the entire population of white blood cells, therefore, neutrophil count is the most relevant to the consequences of pancytopenia.

In our CDI Pocket Guide®, we have previously written that one of the diagnostic criteria for neutropenia is an absolute neutrophil count (ANC) of <1.8K.  Several readers have recently asked us whether a total white blood cell count (WBC) below normal is sufficient.

From a practical point of view, given that up to 70% of white cells are neutrophils, there is usually a correlation between a drop in WBC count overall and a drop in neutrophil number.

To really answer the question properly, however, it’s necessary to know how the ANC is calculated:

ANC = WBC x [percent neutrophils (also known as polymorphonuclear cells or PMN) + bands].

To illustrate the interdependence between WBC, ANC, and the diagnostic criteria (WBC <4k vs. ANC <1.8k), consider the following examples:

(1) Borderline WBC, borderline ANC, normal bands yields a borderline result:

            WBC 4,000 / PMN 40% / bands 5% = 4,000 x .45 = ANC of 1800

(2) Low WBC, borderline ANC, normal bands yields neutropenia and leukopenia

            WBC 3,800 / PMN 40% / bands 5% = 3,800 x .45 = ANC of 1710

(3) Lower WBC, normal PMN (range is 40-70%), and normal bands yields neutropenia and leukopenia:

            WBC 1,900 / PMN 60% / bands 10% = 1,900 x .70 = ANC 1,330

(4) Normal WBC, low neutrophils, no bands yields neutropenia without leukopenia:

            WBC 4,600 / PMN 35% / no bands = 4,600 x .35 = ANC of 1610

(5) Lowish WBC, normal PMN, no bands yields leukopenia without neutropenia

            WBC 3,500 / PMN 60% / no bands = 3,500 x .60 = ANC of 2100

As you can see from the above, a low WBC is a proxy for ANC, but it is not definitive.  The ANC really should be obtained to determine the presence of neutropenia.

Conclusion: Pancytopenia should be understood to be low RBC, low platelets, and low neutrophils.

We hope this clarifies this admittedly confusing matter, and welcome further comments and questions.

Get our CDI Pocket Guide® for more help with pancytopenia.

Who Owns Sepsis?

A recent “Opinion” article by three distinguished professors from Harvard and Washington University in St. Louis titled “Who Owns Sepsis?” was published in the January 2020 issue of the Annals of Internal Medicine addressing the limitations of the Sepsis-3 definition.  

Widespread skepticism in the general medical community outside the critical care specialty has been expressed about the Sepsis-3 definition of sepsis as “life-threatening organ dysfunction” due to infection.  These clinicians worry that the requirement for acute organ dysfunction will result in missed opportunities to identify “early” sepsis before acute organ dysfunction develops requiring ICU admission with its associated morbidity and mortality.

Get our CDI Pocket Guide® for more help with the Sepsis-3 criteria.

The authors forcefully and convincingly argue that the clinical concept of “early” sepsis preceding acute organ dysfunction is clinically valid and cannot be omitted from a sepsis definition.

While Sepsis-3 proposed a quick-SOFA (qSOFA) screening tool to prompt full SOFA scoring, it is not designed to identify “early” sepsis without organ dysfunction.  Shannon et al. published a study in the February 20, 2018 issue of the Annals of Internal Medicine showing that the SIRS criteria were more accurate than qSOFA in predicting organ dysfunction.

The authors also expressed concern about the risk of over-treatment from a single management protocol for patients that may present with a broad range for severity.  One size does not fit all even with acute organ dysfunction. A more balanced approach to sepsis diagnosis and management informed by the urgency and intensity of therapy needed is suggested.

They also point out that 50 of the 59 members of the Surviving Sepsis Campaign (SSC) panel, which adopted the Sepsis-3 criteria, are critical care specialists while 85% of sepsis cases are managed by non-intensivists. 

Since SSC has been the authoritative custodian for a unified international definition and management protocol for sepsis, the authors advocate the inclusion of more Emergency Physicians, Internal Medicine and Family Medicine specialists on the SSC panel.

Download the original article published on annals.org

Multi-drug Resistance

For the 2020 ICD-10-CM, new codes were created to capture antibiotic resistance in clinical settings. The intent is to identify antibiotic resistance in the U.S. for our health care database. There are multiple databases both public and private brought together by AHRQ under the Healthcare Cost and Utilization Project (HCUP). The National (Nationwide) Inpatient Sample (NIS) is the largest publicly available all-payer hospital inpatient care database in the United States. Researchers and policymakers use NIS data to identify, track, and analyze trends in health care utilization, access, charges, quality, and outcomes.  

Multidrug-resistant (MDR) infections are associated with increased mortality, length of stay, and hospital costs. MDR is defined as organisms with resistance to one or more antibiotics in three or more antibiotic/antimicrobial drug classes. To identify multidrug resistance, clinicians should have a working knowledge of the drug class of commonly used antibiotics and antimicrobials reported on culture sensitivity testing.

Methicillin-resistant Staphylococcus aureus (MRSA) accounts for up to 80% of bacterial MDR infections. Other commonly encountered MDR bacteria are vancomycin-resistant enterococci (VRE), Acinetobacter, Klebsiella, Pseudomonas, and coliforms, particularly E. coli and Clostridioides (formerly Clostridium) difficile.

MDR tuberculosis infection is increasingly common and particularly worrisome because many strains are resistant to all known antitubercular drugs. MDR Candida are also becoming problematic. Parasites and many viral pathogens are also becoming resistant to many antimicrobials.

High-risk MDR circumstances (Table 2) include immunosuppression from any cause, history of an MDR infection, known colonization by an MDR organism, and exposure to an MDR-infected person even at home. Structural lung disease, as in cystic fibrosis and bronchiectasis, is typically associated with Pseudomonas colonization and pneumonia, often with multi-drug resistance.

The three most common inpatient situations associated with multi-drug resistance are ventilator-associated pneumonia (VAP), catheter-related bloodstream infection (CRBSI), and catheter-associated urinary tract infection (CAUTI).

The new Category Z16 was created for the new drug resistance codes identifying the antibiotics to which the infectious organism is resistant (Table 3). The codes do not require the clinical MDR definition of resistance to 3 or more classes of antibiotics. In most cases, the codes specify an entire class of drugs keeping in mind there may be only a single drug in a class like vancomycin and clindamycin.

The provider must document the drug resistance in the record. If the provider documents resistance to multiple drug classes, a code is assigned for each of the drugs identified. If only “multi-drug resistance” is documented, code Z16.24 (multidrug resistance) is assigned.  Category Z16 codes are classified as CCs but not assigned to an HCC.

It’s the coder’s responsibility to assign a code for the correct drug class based on the antibiotics specified. For example, if the clinician documents resistance to gentamicin based on sensitivity testing, the coder must know that the aminoglycoside code (Z16.29) should be used. Table 1 should be helpful but coding software ought to lead the coder from a specific antibiotic to the correct drug-class code.

The type of infection is coded first, followed by a code for the organism—unless the infection code itself describes the organism (e.g. code J13, pneumococcal pneumonia)—and then the drug resistance code. In the case of MRSA, a drug resistance code is not assigned because the infection code identifies the antibiotic. In contrast, codes for infections caused by other drug-resistant organisms do not include the drug and require the additional Z16 code. For example, VRE sepsis is coded A41.81 (sepsis due to enterococcus) + Z16.21 (resistance to vancomycin).

Table 1. Antibiotic drug classes 

Source: CDC. Antimicrobial Use and Resistance (AUR) Module—Appendix B.

Table 2. Circumstances posing high risk of multi-drug resistance (MDR)

Derived from multiple sources. 

Table 3. Selected ICD-10-CM drug resistance codes

Drug Code
Multi-drug Z16.24
Penicillins Z16.11
Cephalosporins Z16.19
Quinolones Z16.23
Vancomycin Z16.21
Aminoglycosides Z16.29
Antifungal Z16.32
Antimycobacterial, multiple drugs Z16.342
Antiparasitic Z16.31
Antiviral Z16.33

Source: ICD-10-CM.

MCC-CC Listings for MS-DRGs FY2020

Complete MCC-CC Listings for MS-DRGs FY2020

FY2020 MCC-CC List

Get our CDI Pocket Guide for more help.

CMS-HCC Listing Version 24.0 with ICD-10 Codes

CMS-Version 24.0 list and HCCs sorted by ICD-10 codes and HCC.

Note that CMS has not updated the HCC listing with the most recent ICD-10 code updates.

CMS-HCC V24.0 List and ICD-10 codes

Everything you need to know about P/F Ratio and how to calculate PaO2/FIO2

What is the P/F Ratio?

The P/F ratio is a powerful objective tool to identify acute hypoxemic respiratory failure when supplemental oxygen has already been administered and no room air ABG is available, or pulse oximetry readings are unreliable.

The diagnostic criteria for acute hypoxemic respiratory failure is:

The P/F ratio indicates what the PaO2 would be on room air (if patient was taken off oxygen):

The P/F ratio should not be used to diagnose acute on chronic respiratory failure since many patients with chronic respiratory failure already have a P/F ratio < 300 (PaO2 < 60) in their baseline stable state which is why they are treated with chronic supplemental home oxygen.

Note that PaO2 and pO2 are synonymous.

Get our CDI Pocket Guide® for more help with the P/F ratio.   


How to Calculate the P/F Ratio: PaO2 / FIO2

“P” represents PaO2 (arterial pO2) from the ABG. “F” represents the FIO2 – the fraction (percent) of inspired oxygen that the patient is receiving expressed as a decimal (40% oxygen = FIO2 of 0.40). P divided by F = P/F ratio.

Example:
PaO2 = 90 on 40% oxygen (FIO2 = 0.40):  90 / 0.40 = P/F ratio = 225.
A P/F ratio of 225 is equivalent to a pO2 of 45 mmHg, which is significantly < 60 mmHg on room air.


How to Calculate FIO2 from Liters

A nasal cannula provides oxygen at adjustable flow rates in liters of oxygen per minute (L/min or “LPM”).  The actual FIO2 (percent oxygen) delivered by nasal cannula is somewhat variable and less reliable than with a mask but can be estimated as shown in the Table below as the accepted clinical standard for the conversion. The FIO2 derived from nasal cannula flow rates can then be used to calculate the P/F ratio. Note: Assumes room air is 20% (0.20) and each L/min of oxygen = +4% (0.04). 

Example: A patient has a pO2 of 85mmHg on ABG while receiving 5 liters/minute of oxygen. 5 L/min = 40% oxygen  = FIO2 of 0.40. The P/F ratio = 85 divided by 0.40 = 212.5.


How to Calculate SpO2 to PaO2 (when no ABG available)

When the PaO2 is unknown because an ABG is not available, the SpO2 measured by pulse oximetry can be used to approximate the PaO2, as shown in the Table below.

*Note the SpO2/PaO2 conversion becomes unreliable when SpO2 is > 98%, but PaO2 of 110 mmHg for 97% may be used as a substitute avoiding an overestimation.

Example:
Patient has a pulse oximetry SpO2 of 95% on 40% oxygen:  SpO2 95% is equal to PaO2 of 80mmHg. P/F ratio = 80 divided by 0.40 = 200.

Although the patient may be stable and asymptomatic while receiving 40% oxygen, the patient still has severe acute respiratory failure. If oxygen were withdrawn leaving the patient on room air, the PaO2 would only be 40 mmHg (much less than 60 mmHg criteria on room air for acute respiratory failure). Clinicians commonly lose sight of this fact.

Copyright (c) 2019-2022 Pinson & Tang LLC.

Acute Kidney Injury (AKI): Creatinine Baseline Explained

AKI Diagnostic Criteria: 1.5x Baseline

A CDI Pocket Guide® customer recently sent us a question regarding the 1.5x diagnostic criteria for acute kidney injury, and we thought others may benefit:

The CDI Pocket Guide® includes one of the AKI diagnostic criteria as: "Increase in Creatinine > 1.5x baseline (historical or measured) which is known or presumed to have occurred within the prior 7 days.”

However, in our "Guidelines" for applying this AKI criterion states: The 1.5x diagnostic criteria “can be applied prospectively and retrospectively with broad interpretation of the baseline level which may be one from 6 months or even one year previously if there is no known CKD.”

How we can have a baseline up to one year old but the diagnostic criteria states within the prior 7 days? 


Known vs. "Presumed" Baseline

A creatinine level from 6 months to as much as a year before may be used as a baseline to identify AKI at the time of admissionif the patient did not have preexisting CKD or another dramatic change in health since then.  If a patient is admitted for an acute illness and the creatinine is > 1.5x the past baseline level, it is “presumed” to have occurred within the prior 7 days, and AKI can be diagnosed.

For example, a previously healthy patient is admitted for nausea, vomiting, diarrhea and dehydration. His creatinine level was 2.0, and his creatinine level four months ago was 1.0. It is presumed that the creatinine increased to twice the previous level during this acute illness (within 7 days) confirming AKI.

In such circumstances the elevated admission creatinine would also be expected to return to or near the historical baseline further confirming it as acute. For example, if the prior baseline were 1.0 and the admission creatinine of 2.0 returned to 1.2 at discharge, the diagnosis of AKI is indisputable.

Should the elevated admission creatinine unexpectedly remain well above the prior baseline, AKI is not fully substantiated.  Further investigation is necessary to determine the cause. For example, an admission creatinine of 2.0 (with a prior baseline of 1.0) that remains elevated between 1.7−2.0 does not confirm AKI.


How to apply to CKD

Patients with CKD may also have AKI if the patient is admitted with a creatinine level that is 1.5x their baseline. For example, a patient with CKD and a stated baseline of 1.8 is admitted with a creatinine of 2.5 which decreases to 1.6 with IV fluids. The true baseline is now 1.6 and 2.5 is > 1.5x this level, confirming AKI with chronic CKD.

Get our CDI Pocket Guide® to learn more acute and chronic kidney injury.

Copyright 2022 Pinson & Tang